Trade: What is the Dashboard?
Article showcasing the Dashboard section of the platform and all its features
What is the Dashboard?
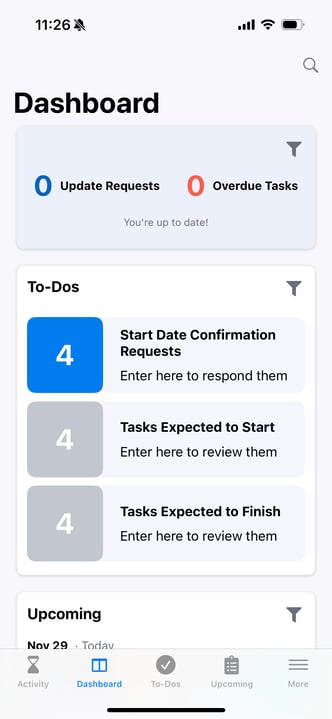
The Dashboard is the first section displayed after you log in to your Trade user account. The different sub-sections visually display immediate actions needed for your Tasks. They also inform about potential delays before sending a crew out. The Dashboard provides a clear view of updates coming from the field.
NOTE: Installers don't have a Dashboard, their initial view is a Task list ready for check-in.
How to locate the Dashboard?
Web Portal:
Click on the Dashboard option in the sidebar of the web portal.
Mobile App:
Tap the Dashboard option at the navigation bar at the bottom.

How to read the Dashboard
The Dashboard provides a high-level summary of your Trade's Tasks to help you quickly understand your day-to-day progress.
The Dashboard is composed of the following sub-sections (components):
-
Update Requests - Display the Proposed Finish dates changes from Installers
-
Overdue Tasks - Display the Tasks that need immediate attention due to a Missed Start or Missed Finish
-
Upcoming Tasks - Display the Tasks that are scheduled to be performed next
-
To-Dos - Display the Tasks that are expected to begin or finish today
-
Commitment Requests - Display the Tasks agreement from a Trade to a Builder for their future scope of work
-
Recent Activity - Display the summary of events that have occurred within your responsible Tasks
NOTE: Within the Dashboard, you are able to tailor the information you would like to be displayed within each widget by clicking on the “filter icon” located in the top right-hand corner of the individual widgets themselves.
